October 13, 2026·7 min read
Canggu Property Prices: Data From 60 Projects
A square meter in Canggu new builds costs a median Rp 53.1 mn. A villa square meter is 30% cheaper than an apartment one, and a studio is the most ex…

Market research
Our reports on rates, occupancy, zoning and net yield by area. These are the numbers we use to model properties for clients.
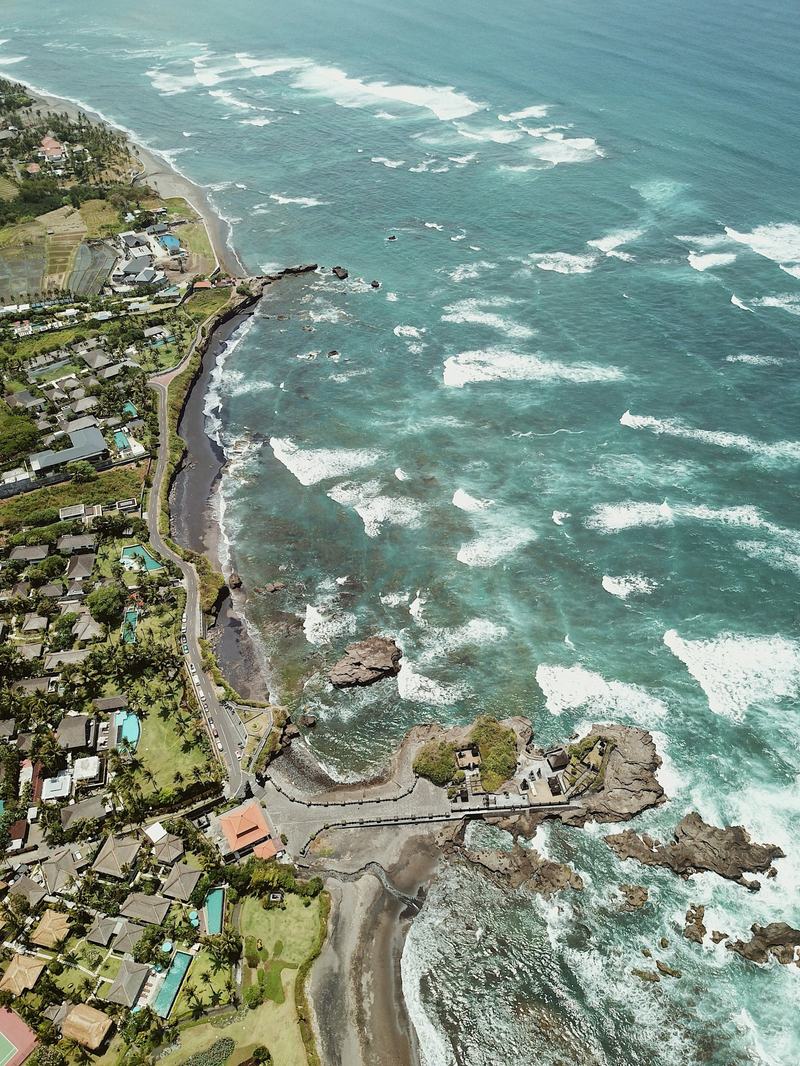
A square meter in Canggu new builds costs a median Rp 53.1 mn. A villa square meter is 30% cheaper than an apartment one, and a studio is the most ex…
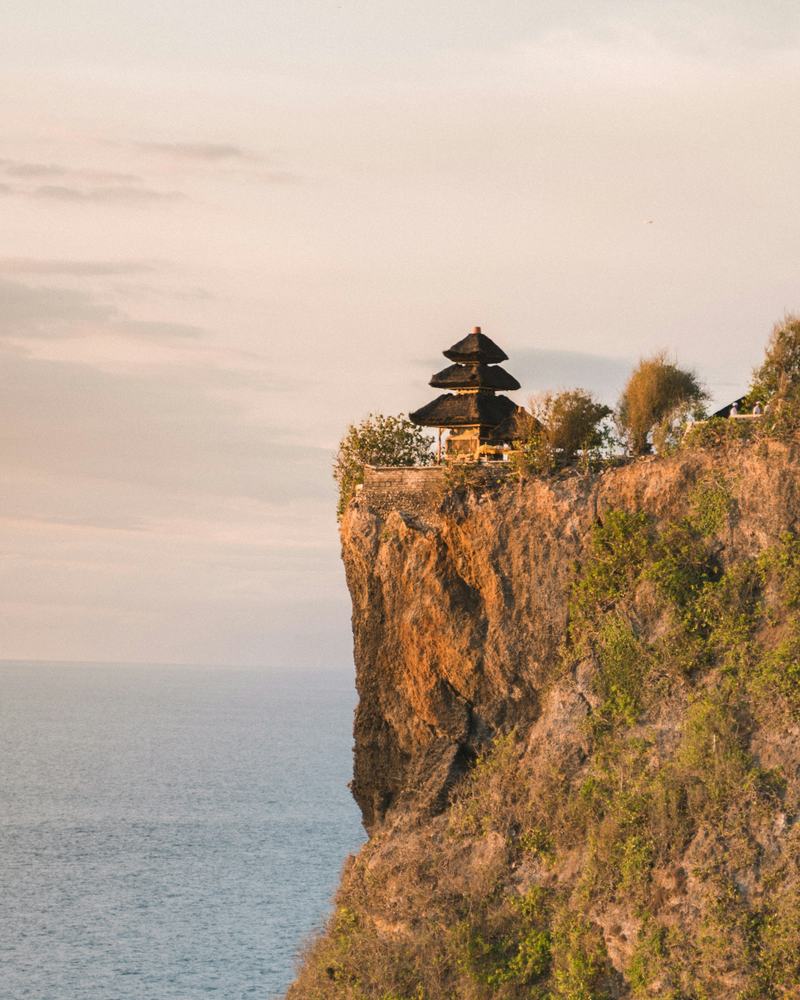
A square meter in Uluwatu and the Bukit costs a median Rp 58.6 mn. An apartment meter is 58% dearer than a villa meter, the widest gap of the five di…

A square meter in Ubud new builds costs a median Rp 46.0 mn, 14% below the Bali-wide median. Two in three unit types are villas, and their meter pric…
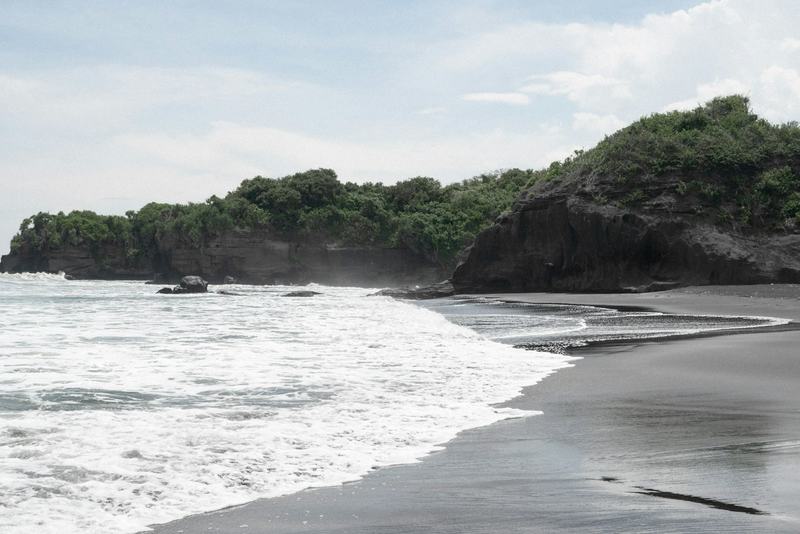
Pererenan and Seseh new builds cost a median Rp 58.9 mn per square meter and Rp 5.15 bn per unit type, the highest unit price of the five districts. …
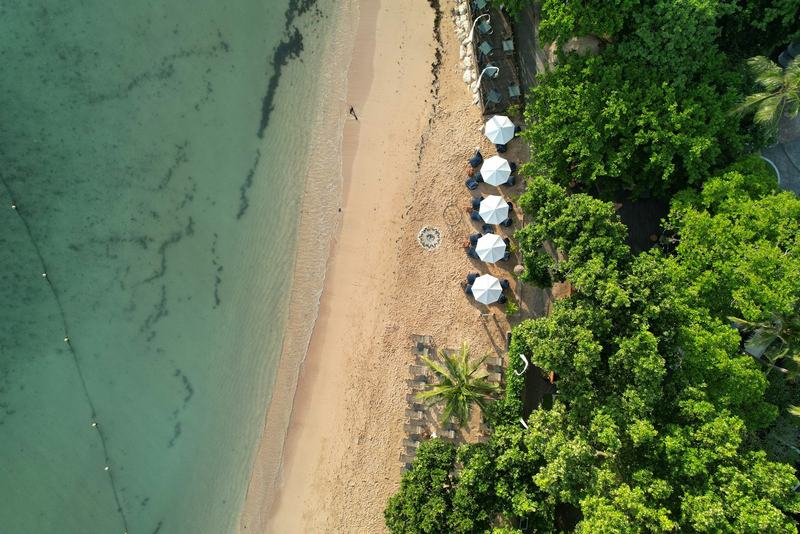
Nusa Dua and Sanur have the lowest unit prices of the five districts: a median Rp 3.19 bn. A villa meter and an apartment meter are only 11% apart.
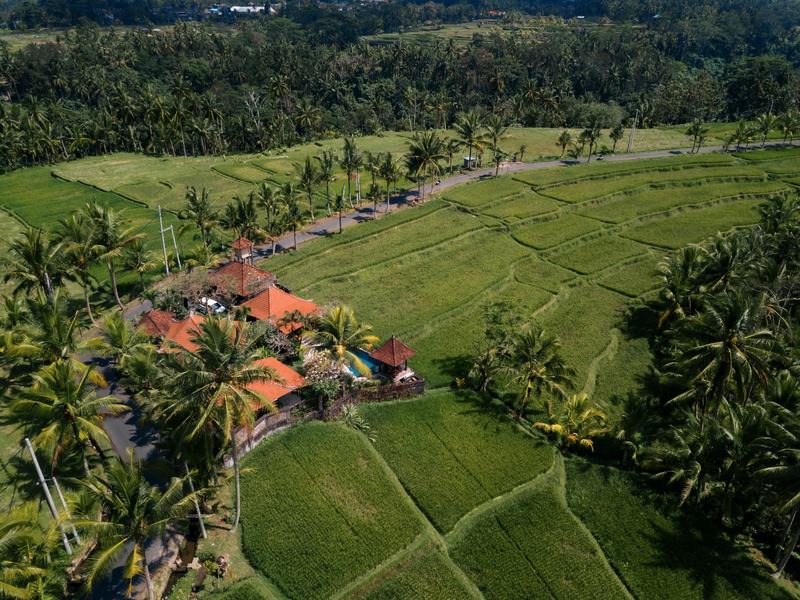
The median price of a square meter in Bali new builds is Rp 53.3 mn. We worked it out from 1,048 unit types in 364 projects in the Rise Real Bali dat…
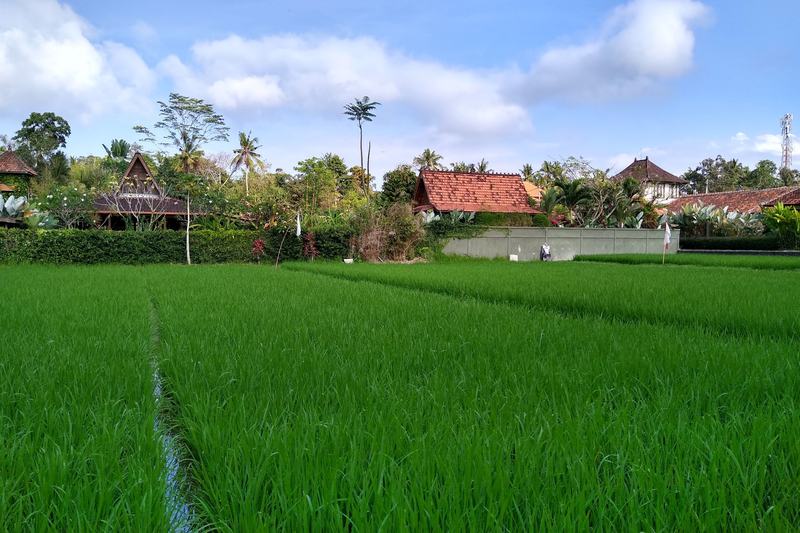
The median leasehold in Bali new builds is 29 years, and 82% of projects offer 30 years or less. Only 9 of the 64 projects that spell out renewal ter…
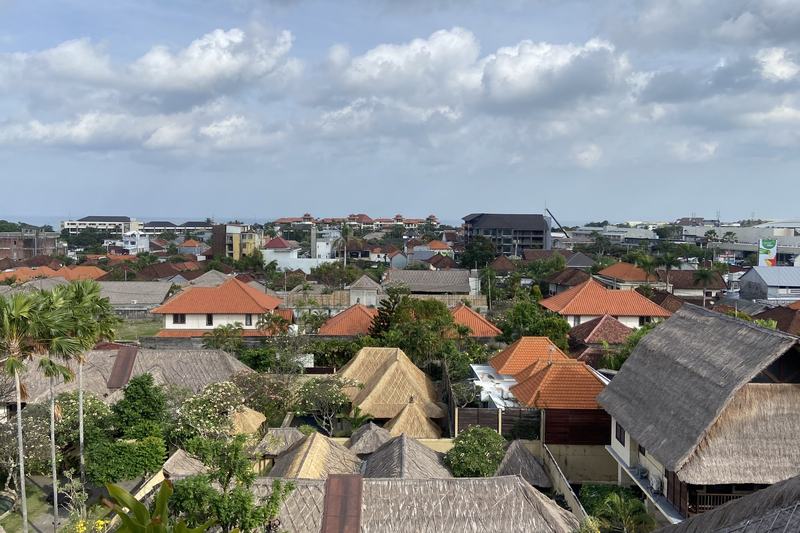
The median advertised yield of Bali new builds is 14% a year. Only 15 of 176 unit types state it as net. Here is how to read these figures and what a…
63% of Bali new builds sit in tourism or mixed zones, 33% in residential zones. In Ungasan most projects are residential. Why the zone matters more t…
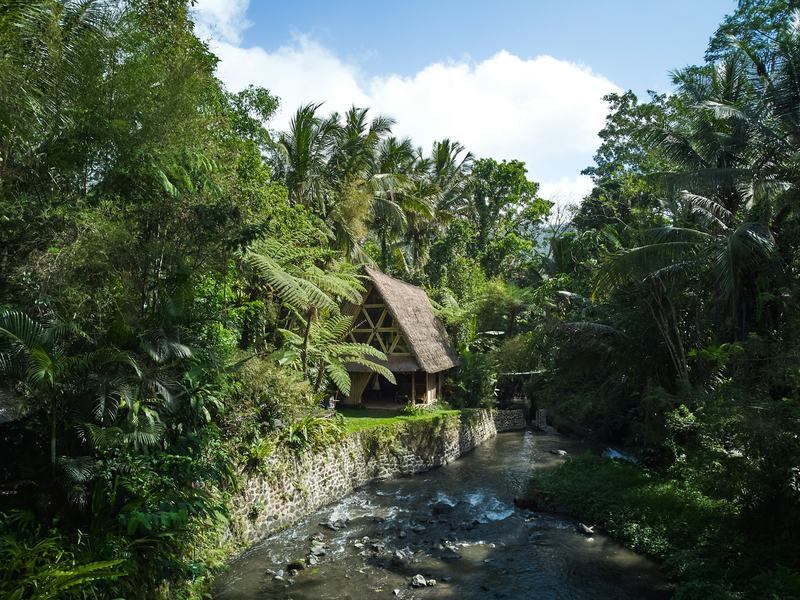
The typical down payment on a Bali new build is 30% of the price. Most projects promise handover in 2027. Managers usually take 20% of revenue, and i…
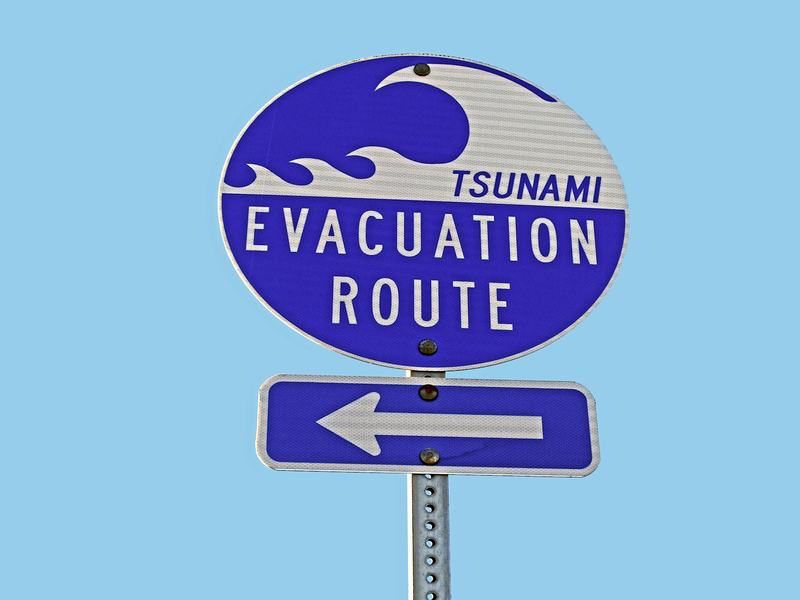
Bali has had destructive waves, but rarely, and the risk depends on the plot far more than on the district.
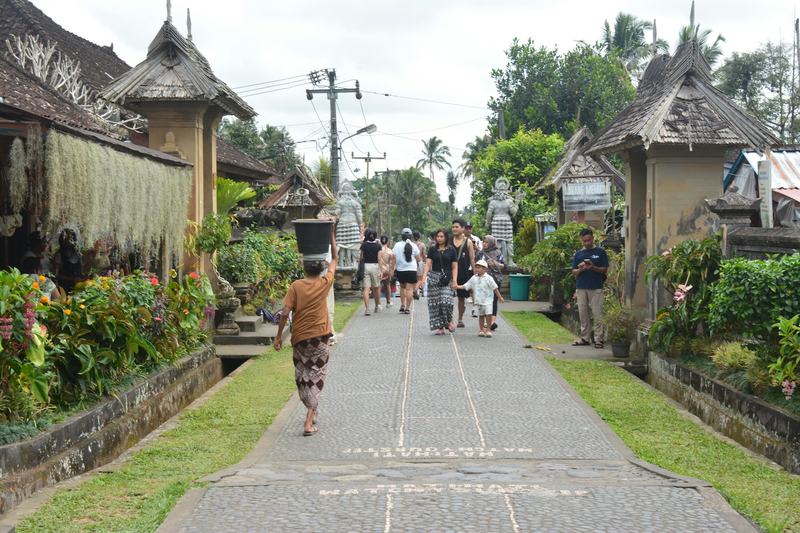
Bali has about 4.4 million residents, depending on which official count you pick, and roughly 86.5% of them are Hindu.
Feed: RSS
Straight answers
Nightly rates, occupancy and trends by area come from average revenue per listing (AirROI, trailing 12 months). The share of listings in agricultural and protected zones, and median prices, come from public for-sale listings. Property details come from developer price lists and presentations. Every model is a Rise Real Bali estimate, not an income guarantee.
Developers show gross yield. We subtract the management company, taxes, vacant nights and maintenance, about 40% of revenue, and show the net under three occupancy scenarios.
Yes, for free and before any deposit. Send a link or the project name on WhatsApp. We'll run it through the same model as our reports and point out which documents are missing.

Hi, I'm Gusti. A question about ownership, tax or permits?
Leave your WhatsApp and I'll send a short answer for your case, checked with our lawyers.